GRSDB Help: Search & Analysis
1.
QGRS Definition
2.
Search & Analysis
3.
Workbench Help
4.
Understanding G-Scores
5.
Dealing with overlaps
6.
Glossary
The search function contains the following user choices which can be combined with a Boolean operator.(Note: all searches are case-independent.)
Search Field
There are fourteen different fields that the user may search on:
| Search Field | Comments |
| Gene ID | The unique identifier used in Entrez Gene |
| Gene Symbol | Standard abbreviation of gene name |
| Aliases | Other names the gene is known by |
| Gene Name | The official NCBI gene name. The user may search for a gene having precisely this name, containing the name, starting or ending with the name. |
| GI | The unique 'GeneInfo' identifier used in NCBI |
| Accession # | NCBI accession number |
| Chromosome | The chromosome on which the gene is located |
| Gene size | A range of values for the length (nucelotides) of the gene |
| Number of Products | Allows user to look for genes having a number of mRNA products in a given range |
| Number of PolyA Signals | Allows user to look for genes having a number of polyA signals in a given range |
| Organism | The user may perform a search on a particular set of organisms or all organisms (which is the default). |
| GO function | Gene Ontology function |
| GO process | Gene Ontology process |
| GO component | Gene Ontology component |
Query results
Suppose that we wanted to consider alternatively spliced human or rat genes involved in apoptosis.
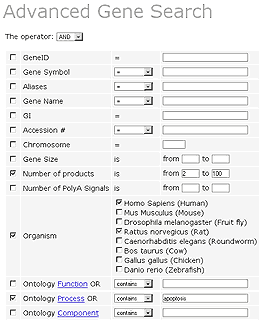
This results in several hits. The first page of results is shown below. The results may be sorted using any of the columns. For example, sorting by Gene Size arranges the genes in increasing order of gene size.
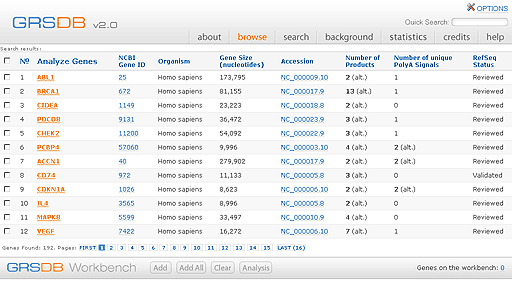
The user may further analyze genes by putting them into a Workbench, where various programs are available to study QGRS distribution patterns for a particular set of genes.
There are several OPTIONS that control how the user wishes to display results for a specific gene. The options are set in the following window:
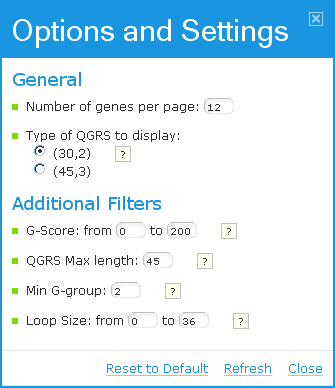
The following options are available to the user:
| Search options |
Comments |
| Number of genes per page |
On the results pages, 12 genes are displayed per page by default. |
| Type of QGRS to display |
There are two categories of QGRS that may be selected from (although the user has additional QGRS filters described below).
(30, 2) selects all QGRS of length at most 30 nucleotides and having at least 2 G's per G-group
(45,3) selects all QGRS of length at most 45 and having at least 3 G's per G-group.
|
| G-score |
Only QGRS having a G-score in the selected range are displayed |
| QGRS Max Length |
The maximum length of QGRS. |
| Min G-group |
The minimum number of G's in each G-group. 2 G's are the default value. |
| Loop Size |
Only QGRS having all three loops in the selected range are displayed. Default range is 0 to 36. However, only up to one loop is allowed to be of length zero. Please see QGRS Definition in the Help. |
QGRS Analysis
G-quadruplex may be displayed in five different views:
Gene View, Data View (no overlaps), Data View (with overlaps), Sequence View, Graphics View.
Gene View
To analyze a particular gene one clicks on the entry in the Analyze Genes column. Suppose we select the PCBP4 gene. This leads to a page entitled Gene View. This page lists basic gene information, including gene ontology. The number of QGRS (either overlapping or non-overlapping) are listed in both categories (30,2), (45,3).
For each alternatively spliced product a map of the exon and intron structure is given together with QGRS information for that product.
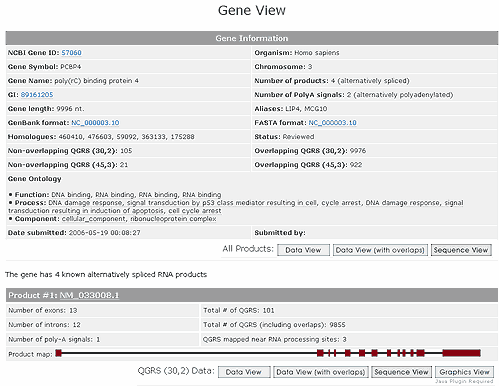
The user can next look at the Data View or Sequence View, either for collection of ALL Products or for any single product. If either view is selected for ALL Products, then information is displayed for each product. Any of the options for filtering QGRS can be set at the Gene View page. Suppose that the options are set so that the each loop must be between 1 and 7 bases.
Data View (no overlaps)
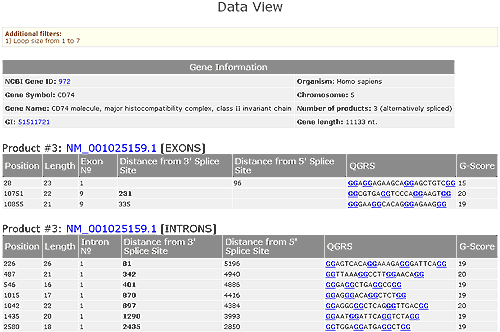
Suppose that the Data View for non-overlapping QGRS for one product has been selected. The QGRS displayed in this view are non-overlapping. Please see Dealing with overlaps to learn about selection of non-overlapping QGRS.
A table of basic gene information is given. Each QGRS in that product is listed as to whether it is in an exon, intron, or near a polyA signal (which is defined to be within 200 nucleotides of the signal).
For QGRS in exons the following information is given: length of the sequence, which exon the QGRS is located in, distance from 3' and 5' splice sites, the specific nucleotide sequence, and the G-score of the sequence. Each QGRS is assigned a numerical value, called its G-score. The higher the G-score the more likely will the sequence form a stable unimolecular G-quadruplex. For more on G-scores see the help section Understanding G-Scores.
For QGRS in introns the following information is given: length of the sequence, which intron the QGRS is located in, distance from 3' and 5' splice sites, the specific nucleotide sequence, and the G-score of the sequence.
For QGRS near polyA signals the following information is given: length of the sequence, which polyA signal the QGRS is near, where the polyA signal is located, the specific nucleotide sequence, and the G-score of the sequence.
In case no QGRS found with the current settings, nothing is displayed in relevant section of the table.
In addition, the Data View shows any user options that have been selected and allows the user to export the data to Excel. Shown below is the Data View for the product NM_00105158.1 of the PCBP4 gene using loop sizes between 1 and 7 nucleotides.
Data View (with overlaps)
Gives a display similar to the above, except that all QGRS overlapping or not, are displayed.
Sequence View
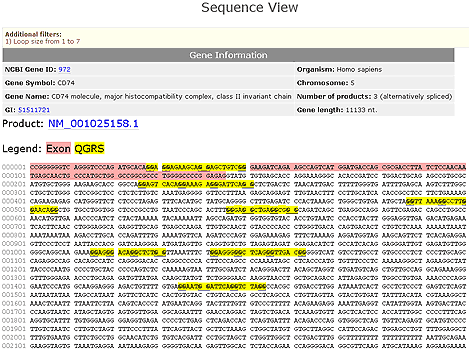
The nucleotide sequence for the entire gene is displayed. Exons are listed in purple and each QGRS is shown in yellow. Basic gene information is given and any filters that have been set are shown. Shown below is the Sequence View for the product NM_00105158.1 of the PCBP4 gene with loop sizes between 1 and 7 nucleotides.
Graphics View
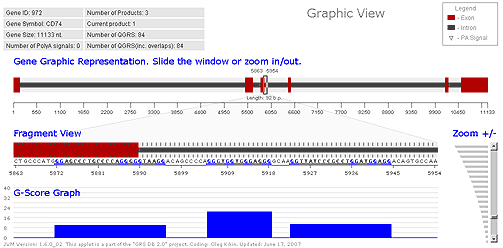
The user can also choose the Graphics View to give a visual display of the location of QGRS. This allows the user to see the location of QGRS relative to exons and introns (if that information is available). The Graphics View has the following components:
- A graphic display of the entire gene (showing the location of the exons). This display includes a sliding window that can be used to focus on any particular segment of the gene. This window may be dragged to the left or right to change position within the gene.
- A magnified view of the fragment of the gene within the sliding window.
- A graph showing the location of QGRS within the fragment, with each QGRS being displayed by a bar whose height represents its G-score.
- A vertical slider that allows the user to change the size of the window. This allows the user to zoom in or out on any part of the gene. The sliding window on the gene expands or contracts as one zooms in or out. It is possible to see the nucleotide sequence of the product at maximum zoom in levels.
