GRSDB Help: Workbench
1.
QGRS Definition
2.
Search & Analysis
3.
Workbench Help
4.
Understanding G-Scores
5.
Dealing with overlaps
6.
Glossary
The user may analyze sets of genes by putting them into a Workbench, where a variety of programs are available to study QGRS distribution patterns for that particular gene set.
After conducting a search, all genes satisfying the search are displayed in a results page. Any subset of those genes may be put onto the Workbench. For example, suppose that we wanted to consider alternatively spliced human or rat genes involved in apoptosis. This query results in a large number of hits:
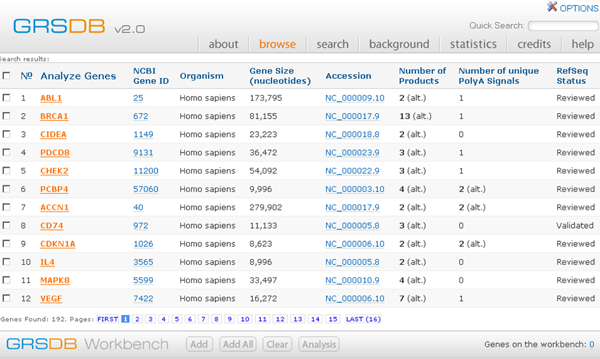 Search Results: Alternatively Spliced human or rat genes involved in apoptosis
There are four controls at the bottom of the page for working with the Workbench.
Add This adds to the Workbench all genes which the user has checked in the first column on the left. To add all genes from the current page check the box at the top of the first column. If the user wishes to add genes from several pages, these must be entered one page at a time. Genes from different queries may be added to the Workbench.
Add All This adds to the Workbench all genes resulting from the query.
Clear Clears all of genes currently loaded into the Workbench. Note: If the user is performing multiple queries then the all of the genes added to the Workbench will remain there, unless the user clears the Workbench.
Analysis This takes the user to the Workbench page, where all genes added to the Workbench may be analyzed.
Suppose that all of the genes from the above query are added to the Workbench and that the user clicks on the Analysis button. The Workbench page will then look like:
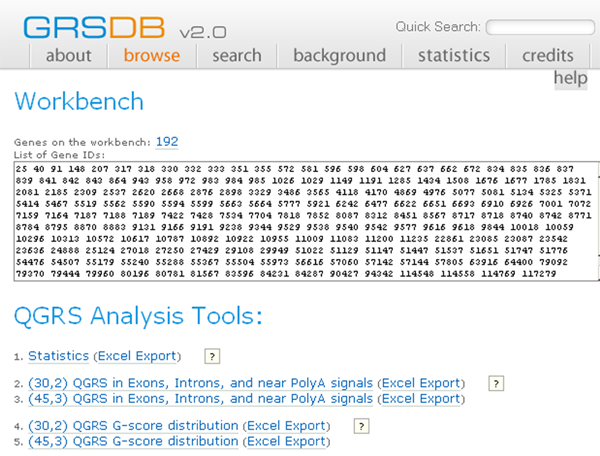 GRSDB Workbench
There are currently five programs available for the user. The output of any of these programs may be exported to Excel for further analysis.
1. Statistics
There are seven columns displayed:
Organism Each organism is displayed which has a gene in the Workbench.
No. of Genes Number of genes for given organism that are currently in the Workbench.
Alternatively Spliced The number and percentage of the genes in the Workbench for the given organism that are alternatively spliced.
Average Gene Size Average is calculated for each organism.
Average number of products This is the average number of products per gene for the given organism.
Number of (30,2) QGRS (non-overlapping) This is the average number of QGRS found in each gene for that organism. Here (30,2) refers to QGRS that are at most 30 nucleotides long and have a minimum of 2 Gs in each G-group. Here non-overlapping refers to QGRS that do not overlap in position in that gene.
Number of (45,3) QGRS (non-overlapping) The same as the previous column except that the maximum length is 45 and the minimum G-group size is 3.
 GRSDB Workbench Statistics
2. (30,2) QGRS in Exons, Introns, and near PolyA signals
This program takes all of the genes in the Workbench and analyzes how many and what percentage of QGRS are near splice sites (both 5 and 3) in exons and in introns. Also shown are how many QGRS are near polyA signals. The word near is taken to mean within 200 nucleotides. Here (30,2) refers to QGRS that are at most 30 nucleotides long and have a minimum of 2 Gs in each G-group.
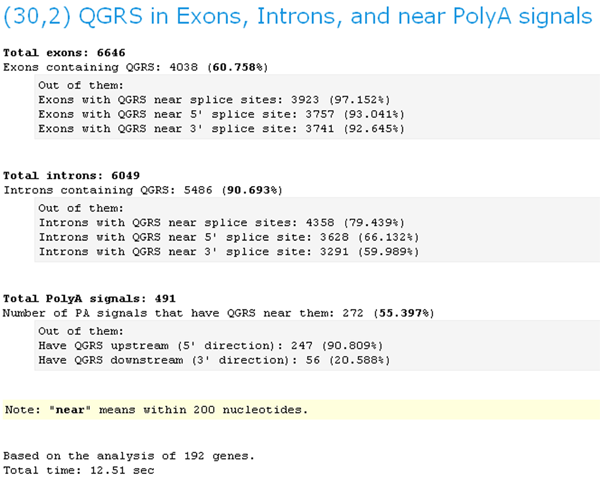 GRSDB Workbench QGRS Distribution (30,2)
3. (45,3) QGRS in Exons, Introns, and near PolyA signals
The same as program 2, except that only QGRS are considered whose maximum length is 45 and whose minimum G-group size is 3.
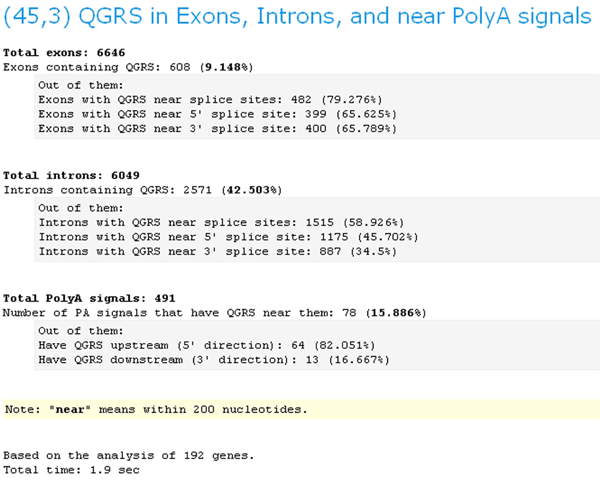 GRSDB Workbench QGRS Distribution (45,3)
4. QGRS (30,2) score distribution
Each QGRS is assigned a numerical value, called its G-score. The higher the G-score the more likely will the sequence form a stable unimolecular G-quadruplex. For more on G-scores see the help section Understanding G-Scores. This program shows the distribution pattern of QGRS with respect to G-scores for the genes in the Workbench. Here (30,2) refers to QGRS that are at most 30 nucleotides long and have a minimum of 2 Gs in each G-group.
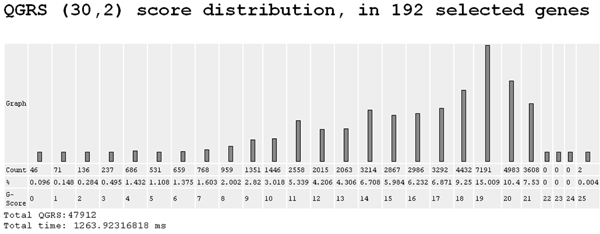 GRSDB Workbench G-score Distribution (30,2)
5. QGRS (45,3) score distribution
The same as program 4, except that only QGRS are considered whose maximum length is 45 and whose minimum G-group size is 3.
 GRSDB Workshop G-score Distribution (45,3)


